
Views: 278 Author: GB FREIGHT Publish Time: 2026-11-18 Origin: Site


Content Menu
● What Are Logistics Performance Metrics?
● How Freight Platforms Collect and Process Shipment Data
>> Connect Information Across the Shipment Journey
>> Standardize Milestones and Shipment References
>> Separate Planned, Estimated, and Actual Events
● Which Freight Performance Metrics Should Importers Track?
>> Define the Denominator Before Comparing Results
>> Measure Predictability Alongside Average Transit Time
● How Performance Tracking Changes by Transport Mode
>> Sea Freight: Measure Beyond Vessel Arrival
>> LCL: Follow Consolidation and Deconsolidation
>> Air Freight and Railway Transportation
● How to Identify the Real Cause of Customs Delays
● How to Check Whether Freight Tracking Data Is Reliable
● An Illustrative LCL Example: Finding the Hidden Bottleneck
● A Practical Five-Step Logistics Performance Review
>> 1. Agree on Shipment Boundaries
>> 2. Establish a Comparable Baseline
>> 3. Assign an Owner to Each Exception
>> 4. Review Exceptions and Trends Separately
>> 5. Verify Improvement Against the Same Rules
● How GB Freight Supports China-Origin Shipping Decisions
>> What is the difference between shipment tracking and logistics performance measurement?
>> Can freight platforms provide real-time visibility for every shipment?
>> Which logistics metric should a small importer monitor first?
>> How should importers compare freight forwarders fairly?
>> Can performance tracking prevent customs inspections?
Freight platforms track logistics performance metrics by collecting shipment events, standardizing milestones, calculating key performance indicators, and highlighting exceptions that need action. For businesses shipping from China, these measurements help answer practical questions: Will the cargo arrive when required? Where is time being lost? Is the lowest freight quote really the lowest-cost option?
At GB FREIGHT AGENCY CO., LTD., our approach to this subject starts with the shipment rather than the dashboard. Drawing on our company's 15 years of international logistics experience, we believe useful reporting should connect supplier readiness, transportation, customs clearance, and final delivery.
This guide explains how freight performance tracking works, which measurements matter, and how importers can turn shipment data into better decisions.

Logistics performance metrics are measurements used to evaluate shipment reliability, speed, cost, and service quality.
Tracking tells you that a container has arrived. Performance measurement tells you whether it arrived as planned, how long release took, and whether the delay affected delivery or cost.
For importers, an effective scorecard should answer four questions:
- Are shipments meeting agreed delivery commitments?
- Which stages create delays or uncertainty?
- How much does transportation actually cost?
- How quickly are problems identified and resolved?
A carrier's vessel arrival record alone cannot answer these questions. Cargo may reach the destination port on schedule but miss warehouse delivery because of documentation issues, terminal congestion, or unavailable trucking appointments.
Freight platforms can receive information through application programming interfaces, electronic data interchange, uploaded documents, and manual updates.
Depending on available integrations, sources may include:
- Supplier booking and cargo-readiness records.
- Ocean carriers, airlines, railway operators, and trucking providers.
- Warehouses and consolidation facilities.
- Customs brokers and destination agents.
- Delivery confirmations and freight invoices.
Integration coverage varies. A platform may receive frequent carrier updates but depend on manual confirmation for supplier pickup or final delivery. Buyers should ask which milestones are automated and which require human input.
Different organizations may describe the same event differently. Platforms need consistent event definitions and linked references to create a usable shipment history.
DCSA's container-shipping standards provide a common structure for exchanging shipment, transport, and equipment events. However, consistent terminology does not automatically guarantee complete data.
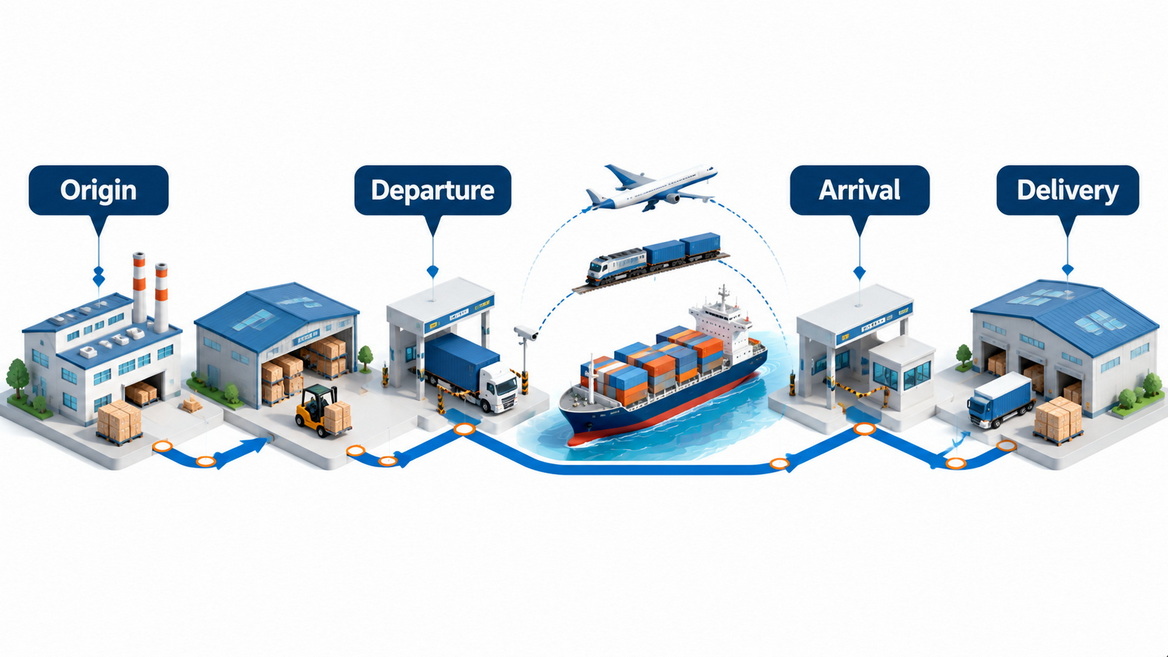
For a China-origin shipment, useful milestones include cargo ready, pickup completed, warehouse received, export released, departed, arrived, import released, and delivered.
A consolidated container may contain multiple individual shipments. The system must connect container-level events with the correct house shipment rather than treating every consignment as operationally identical.
These three timestamps serve different purposes:
- Planned: the agreed schedule or original commitment.
- Estimated: the current forecast.
- Actual: the recorded event completion.
A revised estimated delivery date should not replace the original promise when measuring service reliability. Otherwise, repeated schedule changes can make late shipments appear on time.
Keep both the original commitment and subsequent forecasts. One measures delivery performance; the other supports current planning.
Start with a small group of metrics tied to inventory availability, shipment risk, and controllable costs.
| Metric | Recommended calculation | Practical use |
|---|---|---|
| On-time delivery | Shipments delivered within the agreed window ÷ eligible shipments × 100 | Measures commitment reliability |
| Door-to-door lead time | Delivery timestamp minus the agreed origin start event | Supports replenishment planning |
| Arrival-to-release time | Release timestamp minus arrival timestamp | Identifies border-related delays |
| Milestone completeness | Required events with valid records ÷ required events × 100 | Tests reporting coverage |
| Exception response time | First meaningful response minus exception detection | Measures operational responsiveness |
| Freight cost variance | Actual cost minus approved quotation | Reveals unexpected charges |
| Damage or shortage rate | Affected shipments ÷ delivered shipments × 100 | Monitors handling outcomes |
On-time delivery becomes misleading when teams use different eligibility rules.
A useful reporting method groups shipments by the delivery dates originally promised during the reporting period. Shipments that remain undelivered after those dates should not disappear from the calculation.
For example, if 100 shipments were due during a month and 92 arrived within their agreed windows, the on-time rate is 92%. Record exclusions, such as customer-requested postponements, separately and explain them.
Also define whether "delivery" means arrival at the receiving gate, unloading completion, or signed proof of delivery.
An average can hide unreliable service.
Two routes may have similar average lead times but very different variation. A route with frequent extreme delays may require more inventory protection.
Alongside the average, review the median and the 90th-percentile lead time. The latter indicates the duration within which approximately 90% of observed shipments were completed, subject to the calculation method.
Always show sample size and reporting period. A handful of shipments cannot establish a dependable long-term benchmark.
For sea freight, separate origin handling, ocean transit, transshipment, destination release, and inland delivery.
This distinction matters because port arrival is not cargo availability. Importers also need visibility into unloading, release requirements, terminal collection, and delivery scheduling.
The World Bank's 2023 logistics report recorded an average of 44 days across potential trade routes between export-port entry and destination-port exit. This historical global figure illustrates the importance of measuring the wider journey; it is not a current quotation or a forecast for a specific China route.
Less than Container Load shipments involve shared container space and additional handling stages.
Useful LCL metrics include:
- Supplier cargo-readiness accuracy.
- Origin warehouse receiving time.
- Cutoff compliance.
- Consolidation waiting time.
- Destination deconsolidation time.
- Availability-to-delivery time.
A container-level arrival update does not prove that an individual LCL shipment is ready for collection. Shipment-level release information remains essential.
For air freight, monitor cargo acceptance, security or documentation exceptions, uplift confirmation, transfer connections, destination release, and final delivery.
For railway transportation, monitor terminal acceptance, departure, border handovers, terminal dwell, customs release, and onward transport.
Avoid comparing modes using headline transit times with different boundaries. Airport-to-airport air freight and supplier-to-warehouse rail service are not equivalent measurements.
"Customs delay" is often too broad to support improvement.
A shipment may wait because documents were submitted late, an inspection was required, another agency intervened, or collection was not arranged after release.
The World Customs Organization's Time Release Study methodology measures the interval from arrival to physical release. Its updated 2025 guide reinforces the value of examining the steps within that process.
For operational reporting, separate:
1. Arrival to declaration submission.
2. Submission to assessment or inspection.
3. Assessment to release authorization.
4. Release to physical collection.
This breakdown helps distinguish broker preparation, regulatory controls, and post-release logistics. It also prevents unfairly assigning every destination delay to customs authorities.
A polished dashboard can still contain incomplete or outdated information.
Before relying on a report, check:
- Data freshness: When was the underlying source last updated?
- Event completeness: Are critical milestones missing?
- Timestamp consistency: Are time zones and date formats standardized?
- Source identification: Was the update carrier-reported, agent-confirmed, or inferred?
- Revision history: Can users see changes to delivery forecasts?
Record both the time an event happened and the time the platform received it. An arrival event transmitted hours later may be historically accurate but too late for timely intervention.
Automated forecasts should also remain distinguishable from confirmed events. A prediction is useful planning information, not proof that cargo has moved.
Consider a hypothetical importer receiving LCL cargo from several Chinese suppliers.
Its ocean transit appears stable, yet warehouse deliveries repeatedly miss internal inventory dates. The importer initially considers changing the ocean service.
A milestone review reveals a different problem:
| Shipment stage | Illustrative finding | Possible response |
|---|---|---|
| Supplier readiness | One supplier repeatedly misses the agreed date | Confirm readiness earlier |
| Consolidation | Late cargo misses the planned cutoff | Review consolidation options |
| Destination handling | Documents are incomplete before arrival | Introduce a pre-arrival check |
| Final delivery | Appointments are requested after release | Coordinate receiving availability sooner |
The lesson is not that one transport mode is better. It is that faster linehaul would not necessarily solve delays occurring before departure or after arrival.
This example is explanatory only. It is not a GB Freight customer case or a documented performance result.

Define when measurement starts and ends. Supplier pickup, warehouse receipt, port entry, and carrier departure are different starting points.
Match the measurement to the service purchased and the business decision being made.
Review shipments with similar origins, destinations, modes, cargo profiles, and service scopes.
Keep urgent air shipments separate from routine sea freight. Flag disruptions rather than silently removing them from reports.
Every alert should identify the affected shipment, operational risk, responsible person, next action, and update deadline.
"Delayed" is a status. "Broker checking the missing document; update due this afternoon" is actionable communication.

Active shipments need timely exception management. Completed shipments need periodic trend analysis.
Review recurring causes such as missed cutoffs, document corrections, destination storage, and unsuccessful delivery attempts. Decide which process should change and who owns the change.
After implementing a correction, compare performance using the original definitions.
Do not claim improvement simply because the route mix changed or difficult shipments were excluded. State shipment counts, reporting periods, and relevant limitations.
GB FREIGHT AGENCY CO., LTD. is a China-based freight forwarder with 15 years of international logistics experience.
Our services include sea freight, air freight, railway transportation, customs clearance, warehousing, LCL consolidation, and door-to-door delivery. We coordinate supplier bookings, export procedures, transportation, and final delivery for businesses shipping to Europe, North America, South America, Southeast Asia, the Middle East, Africa, and Oceania.
The practical starting point is your cargo requirement—not a generic transit-time promise.
Send GB Freight your pickup location, destination, cargo description, package dimensions, weight, ready date, and required delivery date. Include your preferred shipping terms and any special handling requirements. Request a quotation that clearly identifies service boundaries, included charges, exclusions, and the milestones you need monitored.
Tracking shows shipment status and movement. Performance measurement evaluates those events against agreed schedules, costs, and service requirements. Tracking supplies the records; measurement makes them useful for operational decisions.
Not necessarily. Visibility depends on carrier connections, partner updates, and milestone coverage. Ask how frequently information refreshes and whether a displayed status is confirmed, estimated, or manually entered.
Start with delivery performance against your required receiving date, supported by door-to-door lead time and cost variance. These measurements connect directly with inventory planning and transportation spending.
Compare equivalent routes, transport modes, service boundaries, and cargo requirements. Review the same reporting period and ask how late or undelivered shipments are counted. Price comparisons should also identify exclusions.
No. Tracking cannot control regulatory decisions. It can help teams identify missing documents, monitor release progress, and coordinate corrective action. Compliance and accurate declarations remain essential.
Note: The prices mentioned above are for reference only. We update our rates on a weekly basis; please contact us to confirm the current costs before arranging any shipments.
1. [eTower / WallTech — "How Do Freight Platforms Track Logistics Performance Metrics?"]
Original article used as the topic foundation. The rewritten guide expands its discussion of data collection, standardized milestones, dashboards, and exception handling into importer-focused procedures. [etowertech]
2. [Digital Container Shipping Association — Track & Trace Standard]
Supports the discussion of standardized shipment, transport, and equipment events and consistent information exchange across container journeys. It does not establish that GB Freight has implemented these standards. [dcsa]
3. [World Bank — "World Bank Releases Logistics Performance Index 2023," April 21, 2023]
Source of the historical 44-day average between export-port entry and destination-port exit across potential trade routes. This is global context, not a route-specific service commitment. [worldbank]
4. [World Customs Organization — Time Release Study Guide, Version 4, 2025]
Supports the arrival-to-physical-release measurement framework and the discussion of identifying bottlenecks within border processes. [wcoomd]


